Due to popular demand I put the source for the script I used here up to github: https://github.com/kai5z/Chladni-patterns
I was browsing around youtube when I stumbled upon this nice video on Chladni patterns (there are quite a few there). Here’s the video, it’s apparently part of some demonstration for students:
Cymatics
Sound propagates in solids, similarly as to how it does in air. If we were to slow down the plate in the video above, we would see it vibrating at the frequency of the sound you can hear being played (check another post of mine).
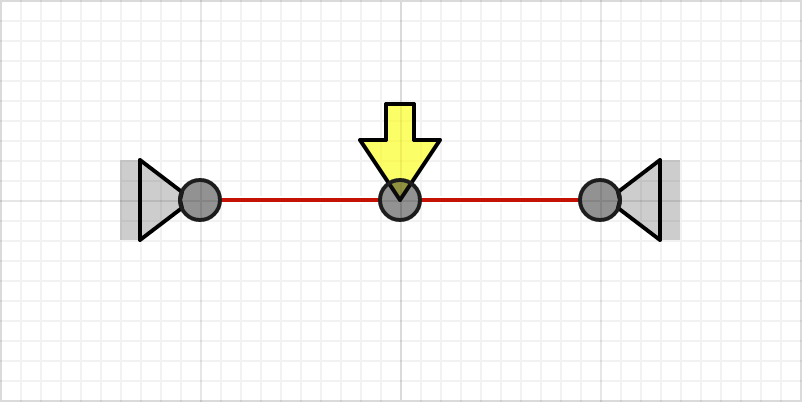
Just as is the case in air, standing waves can form in solids. In solids, the details are quite different, but the basic principle holds. When a standing wave forms, there are locations where the amplitudes of the vibrations have their maximum values, and locations where the amplitudes of the vibrations are very close to zero.
Imagine placing a lot of small particles on the surface in the image. The particles would be tossed around, until they finally find a resting place close to the red circle. This is how all of the patterns are formed, but the way the plate vibrates varies with frequency.
Simulating cymatics
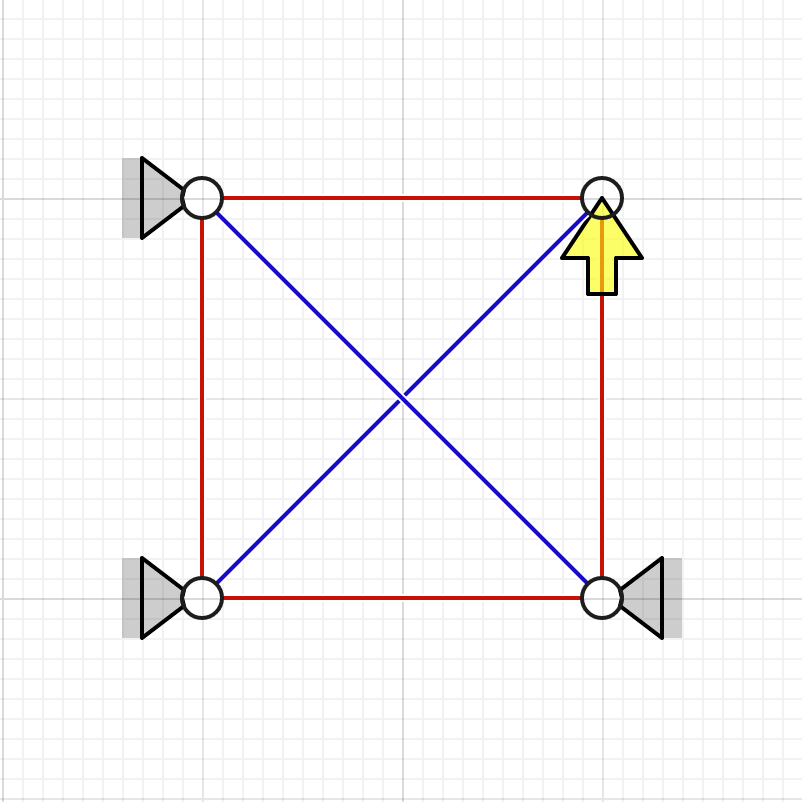
The experiment setup is very clearly defined; a rectangular steel plate is clamped in the middle. This makes for a perfect case to test out some finite element analysis of plate structures!
I used steel as the material of choice for the simulation and Reissner-Mindlin bilinear plate elements, with a lumped mass matrix. I programmed the simulation using Python. By tweaking around with the material properties and dimensions, I managed to roughly match the frequencies to the experiment from the first video. I think it’s really cool how the simulation matches the patterns you can see in the video (up until a point where it’s apparent that there are some asymmetries in the setup).
I made a gif out of the video too, just for the hell of it.
You might have noticed that there are a whole lot of patterns there, which aren’t visible in the video. The standing waves which create the patterns form much more strongly when the frequency is closer to the modal frequencies of the plate (when the plate resonates). The following plot roughly shows these resonant frequencies. The y-axis doesn’t really mean anything significant here, so just pay attention to the peaks. Also, damping hasn’t been taking into account here, making the peaks unrealistically sharp. When the excitation frequency is close to one of those peaks, Chladni patterns should be clearly visible.
Discussion
The frequencies these patterns form on depends completely on the material properties and dimensions of the plate, if we assume that the basic setup is the same (a rectangular plate is clamped at the middle). There are a lot of structures which can be analysed in a similar way (albeit with a more complex analysis for applicable results): floors, windows, doors, the list goes on and on. In this case, the results were very consistent with the video as the physical problem was very clearly defined.
